 In a world of FireFox and its beautiful extensions of web-development power, Internet Explorer has been a horrid browser to develop/debug your code.
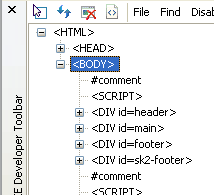
Microsoft has a fancy FireBug clone for the bane of every web developer…Internet Explorer! They call it the Web Developer Toolbar (although it isn’t much of a toolbar and more of a tool set) and it is a blessing for finding problems in IE. Its features include:
- Explore and modify the document object model (DOM) of a Web page.
- Locate and select specific elements on a Web page through a variety of techniques.
- Selectively disable Internet Explorer settings.
- View HTML object class names, ID’s, and details such as link paths, tab index values, and access keys.
- Outline tables, table cells, images, or selected tags.
- Validate HTML, CSS, WAI, and RSS web feed links.
- Display image dimensions, file sizes, path information, and alternate (ALT) text.
- Immediately resize the browser window to a new resolution.
- Selectively clear the browser cache and saved cookies. Choose from all objects or those associated with a given domain.
- Display a fully featured design ruler to help accurately align and measure objects on your pages.
- Find the style rules used to set specific style values on an element.
- View the formatted and syntax colored source of HTML and CSS.
The Developer Toolbar can be pinned to the Internet Explorer browser window or floated separately.
This toolbar isn’t a match for the features, look, or usability of FireBug…but it is a great start and a pretty decent tool provided by the guys at Microsoft. As many developers can attest, developing sites that work according to standards AND Internet Explorer is a pain…this tool eases that pain.
Oh, and once you install the toolbar, it is hard to see where to open the thing. After installing, a little blue arror will appear in the icon bar at the top of the browser. Click that and the tool will open at the bottom of the screen.
Comments
9 responses to “Internet Explorer – Web Developer Toolbar”
To call it a clone of Firebug is quite a stretch. A clone of the Firefox Web Developer Toolbar perhaps. But Firebug goes way beyond this.
Is can’t edit code as fire bug!
girl: it can edit the code like FF, but need to press Enter button.
i like this ie developer toolbar than fierbug.
i hate to click that inspect button everytime i need to check some div or class. the ie tool do the work. only a click and i click anywhere, any as many time as i want.
and ie developer toolbar has never crash the browser, fierbug do crash. it is a know issue in fierfox, and it has been listed as a problematic extensions here
http://kb.mozillazine.org/Problematic_extensions
I agree with passingby in that IE doesn’t crash as much with it’s developer toolbar, but that’s if you can get the damn thing working. And personally I *hate* the way I have to click off the inspection mode to resume using the site normally – I like Firebug’s approach a lot more. Plus, I can inspect elements inside of frames in Firebug, not to mention the vastly superior information it gives.
This is really great. I didn’t know there was a plugin like this!
I am trying to install and use this on my IE for Linux with Wine.
The installation was done without problems, but I don’t see where to open the thing just as pointed out by you.
I didn’t see the “little blue arror will appear in the icon bar” too.
Anyone had any luck on “Internet Explorer Developer Toolbar” IE+Wine+Linux
Thanks to the Author of this Blog for this useful Article
The download link on microsoft wont work!!! Epic fail.
@Ben Crowther:
May be your ISP failed.